Current Land Use

Africa


The Interactive COMPETE Maps synthesise information from a range of high quality sources that have categorised and evaluated land use patterns in Africa with a view to identifying land (a) suitable for biomass production for energy, (b) suitable for biomass production for other uses, and; (c) filtering out land that is not available or not suitable for inclusion in future bioenergy land use scenarios.


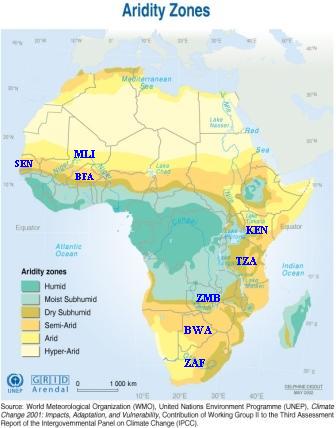
For each of the 8 case study countries, an interactive map has been designed in order to easily determine why part of the land in the arid and semi-arid areas is not available or not suitable for biomass production for energy. Please, click on a country in the map on the right in order to access its profile and download its interactive map.

* Detailed instructions on how to use the maps (including the glossary and the list of criteria) are provided here.

Due to the large size of the files, it is recommended that you download and save the file before working on it.


Areas identified as available and suitable for bioenergy crop production in the eight case study countries:


Country Senegal Burkina
Faso
Mali Kenya Tanzania Zambia Botswana South
Africa
Total area km² 196 013 272 339 1 252 281 581 871 941 375 751 920 587 337 1 221 361
Arid region km² 14 093 5 117 389 734 230 888 n/a n/a 128 289 378 418
Arid region % 7,1 1,9 31 39,7 n/a n/a 22 31
km² of arid region
available and suitable
10 200 0 121 397 209 760 n/a n/a 102 193 353 937
% of arid region
available and suitable
72 0 31 91 n/a n/a 80 94
Semi-arid region km² 97 054 144 856 248 226 227 020 316 738 160 281 453 316 522 927
Semi-arid region % 49,5 53,1 19,8 39 33,6 21,3 78 42,8
km² semi-arid region
available and suitable
5 583 22 756 71 041 169 938 147 252 67 383 189 667 368 944
% semi-arid region
available and suitable
6 15 29 75 46 42 42 70
Arid & semi-arid km² 111 147 149 973 637 960 457 908 316 738 160 281 581 605 901 345
Arid & semi-arid region % 56,6 55 50,8 78,7 33,6 21,3 100 73,8
km² arid & semi-arid
available & suitable
15 783 22 756 192 438 379 698 147 252 67 383 291 860 722 874
% arid & semi-arid
available & suitable
14 15 30 82 46 42 51 79
Comparative ranking of
available & suitable
8 7 4 2 5 6 3 1


For detailed information on current land use and patterns, please consult COMPETE Reports:


- NEW: Policy guidance note on integrating traditional land use and products into bioenergy policy (2009, pdf-file)


- NEW: Understanding traditional and modern land use dynamics in the African context (2009, pdf-file)


- 2008 Task Report on Current Land Use Patterns and Impacts (pdf-file)


- 2007 Task Report on Current Land Use Patterns and Impacts (pdf-file)


For further information, please contact:

Or


South Africa Botswana Senegal Mali Burkina Faso Kenya Tanzania Zambia Africa